My Visual Analytics Journey
Welcome

Hi, I am Mark Yee and welcome to my course portfolio for ISSS608 Visual Analytics and Applications.
This site consists of my journey through the course, updated regularly as I progress through the semester. Head to the About page to learn more about the course.
Latest Updates
📘 Hands-on Exercises
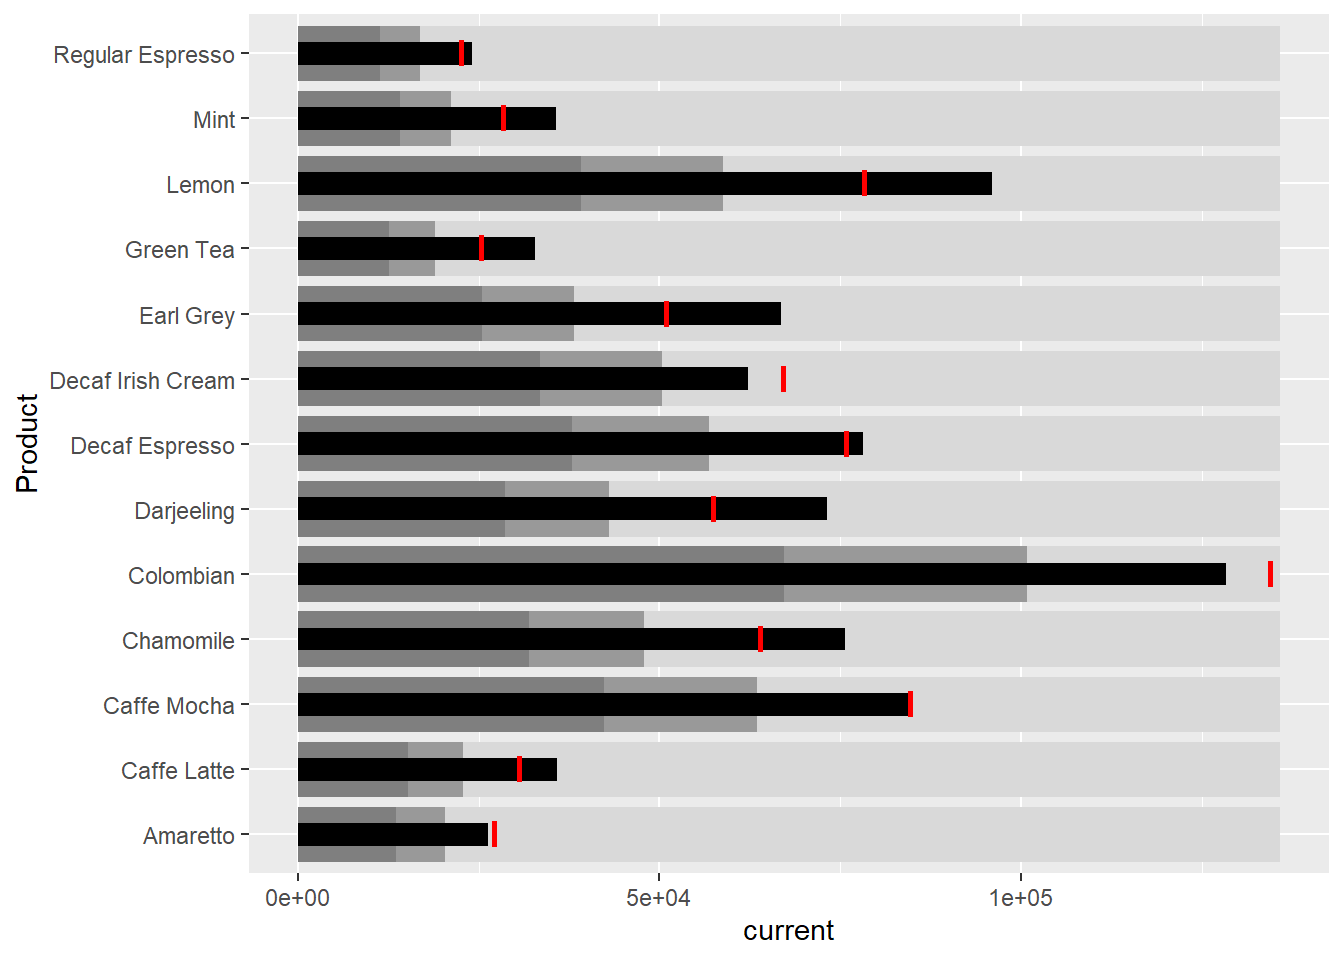
Hands-on Exercise 10 — Information Dashboard Design with R
Explored the building blocks of an information dashboard in R, (1) bullet charts and sparklines drawn with ggplot2, (2) static dashboard tables with inline bullet charts and sparklines built using gt and gtExtras, and (3) interactive dashboard tables built using reactable and reactablefmtr, covering highlighted points, labels, reference lines, bandlines and sparkbars over Coffee Chain sales data.
🖥️ In-class Exercises
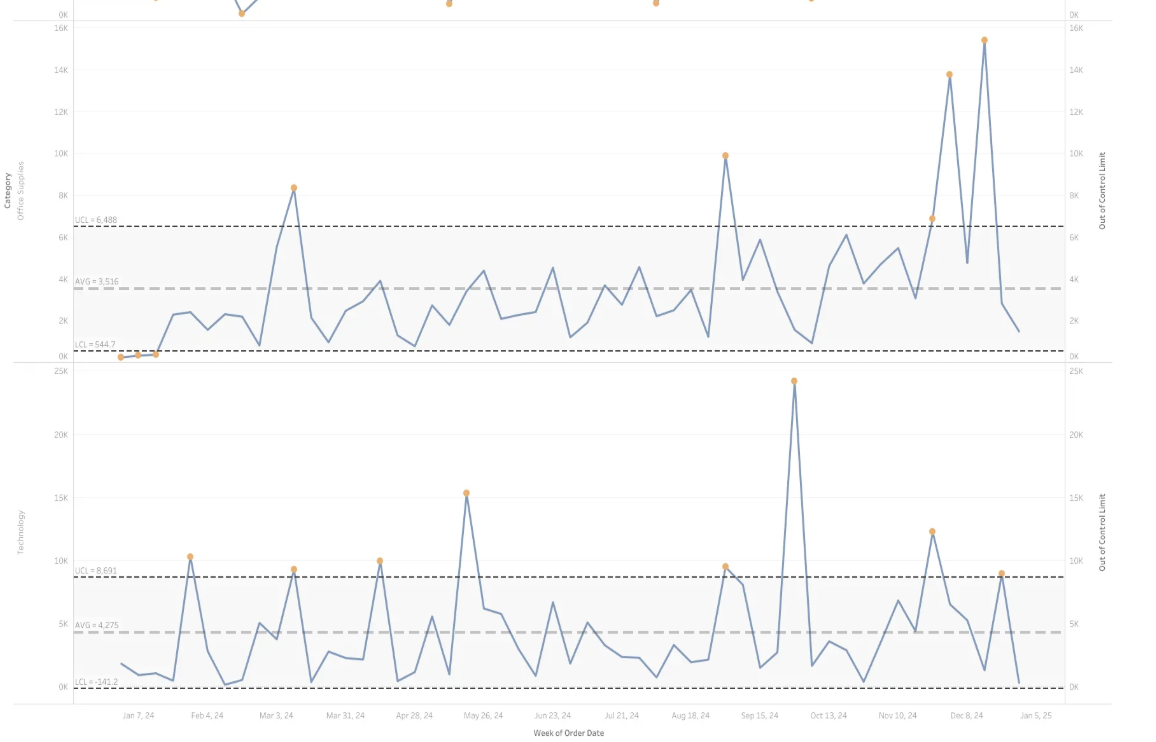
In-Class Exercise 8 — Visual Analysis of Time-oriented Data with Tableau
Built three time-oriented Tableau views and published each to Tableau Public, namely a control chart of sales by category, a slopegraph and a trend-and-cycle view of arrivals. Each view is embedded live on the exercise page.
📝 Take-Home Assignments
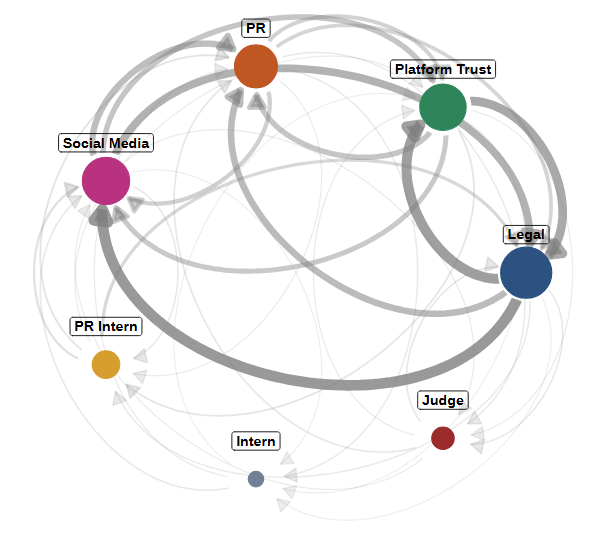
Take-home Assignment 2 — Tracing an embargo leak across an autonomous multi-agent communications system
The analysis covers 912 messages across 23 rounds among seven AI agents communicating over six channels, reconstructing how the merger embargo was broken one hour early.
All Work
Hands-on Exercises
In-class Exercises
Take-home Assignments
Weekly practical exercises applying visual analytics techniques in R.
Short exercises completed during lessons to reinforce key concepts.
Independent projects applying visual analytics to real-world datasets.